Printers
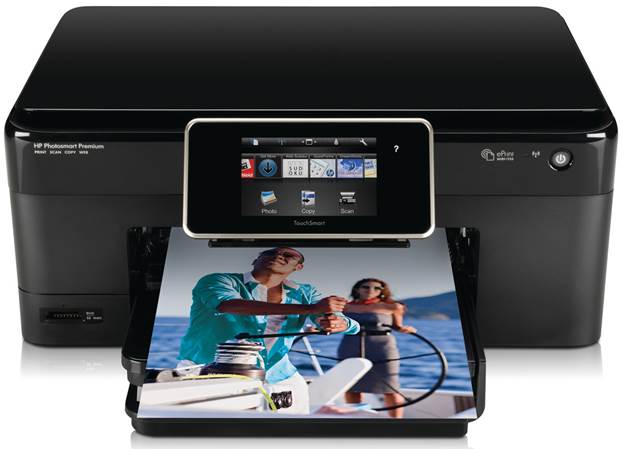
We’ve focused our attention on all-in-one
inkjet printers, the best-selling type. They give you the option of printing in
color as well as lack-and-white, along with copying and scanning functions.
We don’t have reliability information on
printers, but we can offer you advice based on how the major brands have
performed in our tests over the past few years. Dell has only a few all-in-ones
in its line, which we’ve tested, and those have performed well. We’ve also
studied the cost of printing, which can make or break your satisfaction with a
printer over the long term.
Safest
bets
If you’re thinking of buying an all-in-one
inkjet that we haven’t tested, consider models form Canon and HP. That’s the
message from our analysis of three years of Ratings. The Canon models we’re
tested have consistently had solid scores – in fact, some have been among the
best we’ve tested. Given that track record, we believe other Canon printers are
likely to be fine performers. Most of the HP models we’ve tested have done
almost as well, so the odds are in your favor that an untested model should
provide satisfactory or better performance.
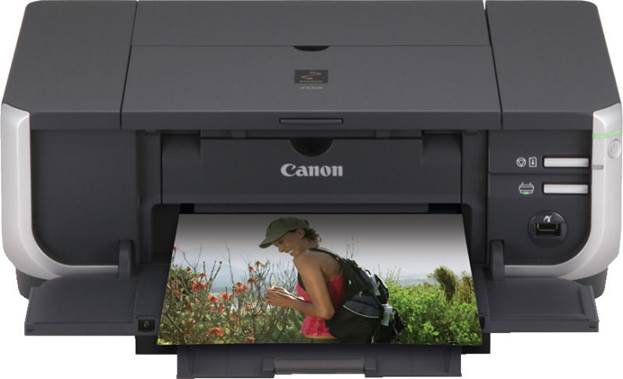
The
Canon models we’re tested have consistently had solid scores – in fact, some
have been among the best we’ve tested.
Safe
bets
Brother, Epson, and Kodak all-in-ones have
mostly had solid or better scores, but a few models from those brands fell
short. In all probability, their printers should be acceptable choices, but
they’re less likely to be high performers than the brands mentioned previously.
Stick
with a tested model
Lexmark all-in-one inkjet models varied in
performance over the past few years. Many of the most recently tested printers
did very well, though some older models had fairly low scores. The trend is
encouraging, but at this point we believe you’d still be best off consulting
our Ratings.
Consider
printing costs.
As we’ve often pointed out, an inkjet
printer’s monthly operating cost is a critical factor to consider. Paying a
bundle for ink and special photo paper over the life of a printer can quickly
wipe out any savings you realized in buying a cheap model. The problem is, you
can’t bank on manufacturer’s estimates, which are often unrealistic. If you’re
greatly concerned about print costs, buy a tested printer. Our Ratings include
monthly cost estimates that are based on what we consider a typical mxi of
text, graphics, and photos.
For the models in our Ratings prints cost
varied quite a bit, from roughly $5 to $13 a month, even for models from the
same manufacturer. Given the cost variation, we can’t’ generalize about which
brand is more or less costly to use. But we did find reassuring news:
Two-thirds of the tested models had prints costs of less than $10 a month.
Computers
It’s hard to generalize about computer
brands for several reasons, including the fact that the configuration, or the
components a specific models has, determines a computer’s speed and
performance. Both of those factors are heavily weighted when we figure a
model’s score.
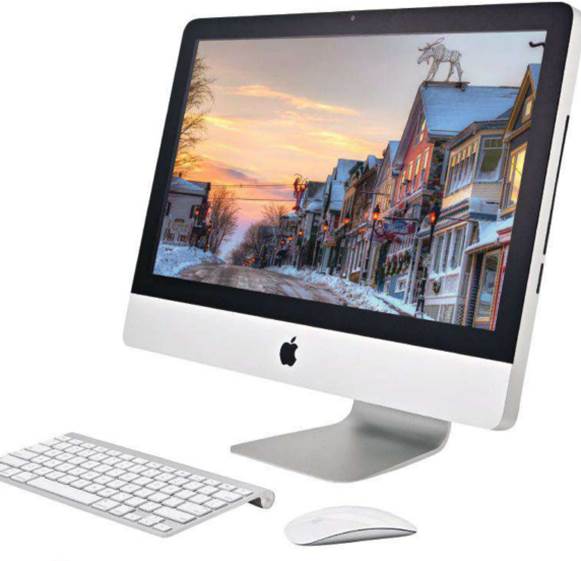
One
brand stands out as the best all-around choice: Apple.
Even so, one brand stands out as the best
all-around choice: Apple. Year after year its laptops and desktops have done
very well in our tests, which have led us to almost invariably recommend Apple
models. Apple also excels in tech support. For reliability, its laptops have
been comparable to Windows-based PCs, and its desktops have had fewer repairs.
Performance
Though Apple has had consistently high
scores, we’ve found has had consistently high scores, we’ve found more
variation in performance among Windows-based PCs. A given PC brand might have
some top-scoring models and others that scored lower. We’re continuing to
analyze our Ratings to look for patterns.
Depending on your needs, other factors
might trump performance. For example, if you travel frequently, size and weight
may be more important than having a full-sized keyboard. Or if your budget is
tight and you’re computing needs fairly basic, a low-priced model with a
less-powerful processor might make the most sense for you.
Generally, we recommend that you stick with
one of the brands we regularly test. Then narrow your choice based on
reliability and tech support, and choose a configuration that suits your needs
and budget.
Tech
support
Tech support in general is among the
lowest-rated series in all of the surveys conducted by the Consumer Reports
National Research Center. But that doesn’t apply to Apple, which beat all the
maker of Windows-based PCs covered in our most recent survey.
Apple solved user problems 73 percent of
the time, compared with 61 percent for its nearest competitor, Dell. Apple also
had higher marks for phone and online support. Apple continues to offer
unlimited free support runs out. Many makers of Windows-based PCs provide free
technical support for a year.
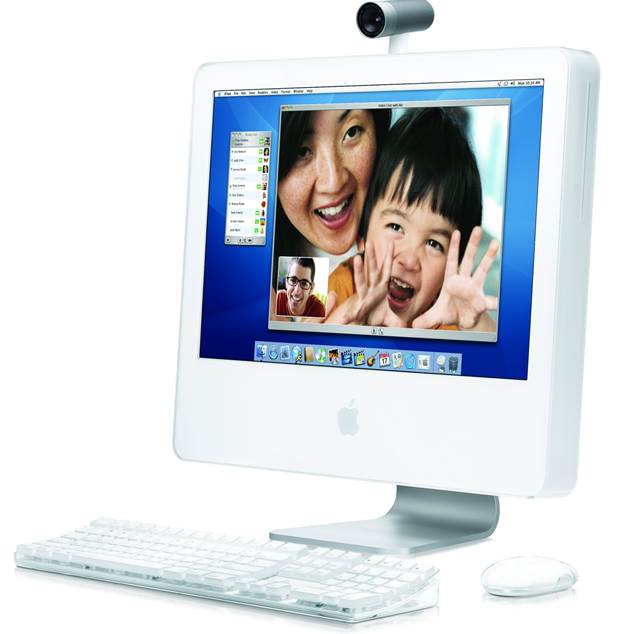
Apple
beats all the maker of Windows-based PCs covered in our most recent survey.
Reliability
Overall, computers have had a higher rate
of repairs than TVs or cameras. No brand of laptops stood out as being more or
less repair prone. The eight brands in our survey had comparable reliability,
with an overall repair rate of 11 percent during the first three years. Among
desktops, Apple has been among the least repair-prone (See chart)
For laptops and desktops, our findings show
that 44 percent of all respondents who had made a repair paid nothing because
they were covered by a fee warranty or service contract. For those who did have
to pay, the median out-of-pocket cost was about $150.
Most
and least reliable
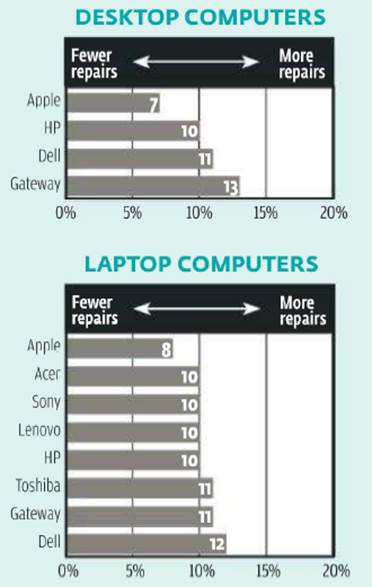
Among
desktops, Apple has been among the least repair-prone
Based on the 2012 Annual Product
Reliability Survey, conducted by the Consumer Reports National Research Center,
for 23,582 laptop computers and 8,007 desktop PCs purchased between 2009 and
the first half of 2012. Differences of fewer than 4 points are not meaningful.
By the numbers
374,728 TVs, cameras, and computers covered
in eh most and least reliable charts
Ratings in order of reader satisfaction score.

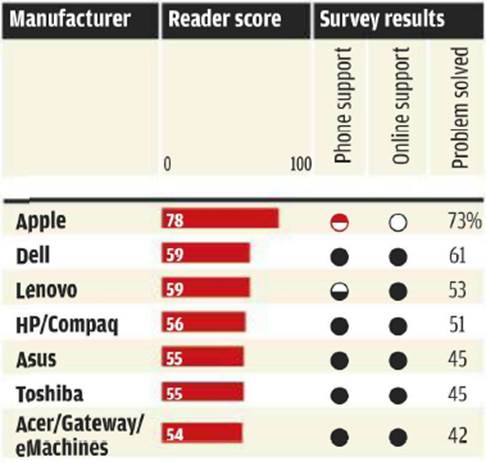
Based on responses from 7,470 owners of
8,652 desktop, laptop, and netbook computers who contacted a manufacturer’s
tech-support service between January 2011 and January 2012. All respondents
were our subscribers. A score of 100 would mean all respondents were completely
satisfied; 80, that respondents were very satisfied, on average; 60, fairly
well satisfied; and 40, somewhat dissatisfied. Differences of fewer than 6
points are not meaningful. Phone support and online support was rated by those
respondents who contacted a manufacturer via a website, e-mail, or online
live-chat program. “Problem solved” indicates the percentage of people who said
the manufacturer solved their problem. Differences of fewer than 9 percentage
points are not meaningful.