Random
and sequential Read/Write
We used CrystalDiskMark 3.0.1 benchmark to
test the random and sequential read and write speeds. This benchmark is
convenient as it can measure the speeds of an SSD with both random incompressible
and fully compressible recurring data. This feature is important for testing
SSDs based on SF-2281/2282 controller, which tries to compress the data before
writing it into the flash-memory. So, there are two numbers in the diagrams
below that reflect the maximum and minimum SSD speeds. The real-life
performance of an SSD is going to be somewhere between those two numbers
depending on how effective the controller data compression is.
Please note that the performance tests in
this section refer to SSDs in their “Fresh Out-of-Box” state (FOB). There is no
degradation that might have happened yet.

Sequential
read

Sequential
write

Random
read 4K

Random
write 4K

Random
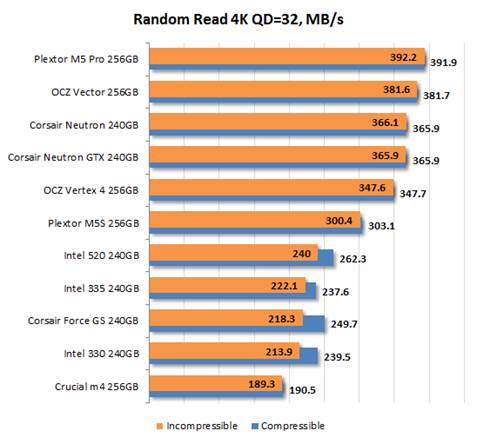
Read 4K QD=32, MB/s

Random
write 4K QD=32, MB/s
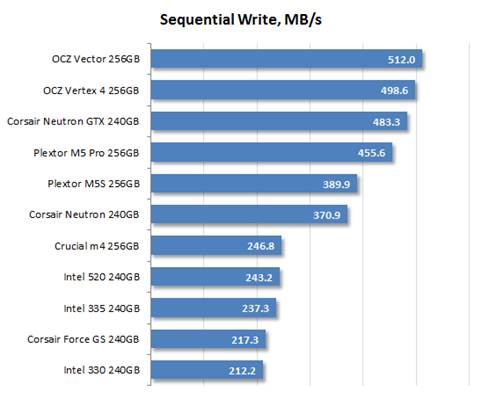
With anything written in the official specifications
of the new Intel SSD 335, we wouldn’t consider it the same as the SSD 330. It
is different for some reasons, which may be the 20nm flash (which theoretically
has lower latency) or firmware, or both. It delivers higher performance than
the Intel SSD 330 when the request queue is long and also is outstanding with
the higher sequential write speed than the other Intel SSDs. The 335 model is better,
however, than the SSD 330 in the other scenarios.
The SSD 335 is also no exception. Its reaction
is generally the same as that of any other SandForce-based SSDs, so it is only
average in performance in temrs of today's standards. Flagship products are remarkably
faster and, unlike their SandForce-based opponents, deliver consistent
performance with any types of data. Intel's SSDs compress data prior to writing
it into the flash memory and get slow down when data is incompressible.
Degradation and steady-state performance
Unfortunately, SSDs are not always as fast
as when they are still new. In most cases their performance goes down in
quality after some time of use and in real life we deal with completely
different write speeds than what we see on the diagrams in the previous chapter
of our review. The reason for this phenomenon is like this: as the SSD lacks
free pages in the flash memory, its controller has to clear memory page blocks
before saving data into them, which causes considerable delays. Although,
modern SSD controllers can reduce the performance drop by erasing unused flash
memory pages, when idle. They use two techniques for that: idle-time garbage
collection and TRIM.
Of course, users should be more interested
in the consistent performance of their SSDs over a long period of time rather
than the top speed they are going to obtain only during the first short-term
usage period, while the drive is still “new”. The SSD makers, however, declare
the speed characteristics of “fresh” SSDs for marketing reasons. That’s why we
decided to test the performance hit that would occur when a “fresh” SSD becomes
an old one.
To get a complete picture of SSD
performance degradation we ran special tests based on the SNIA SSSI TWG PTS
(Solid State Storage Performance Test Specification) methodology. The main idea
of this approach is to measure the one-by-one write speed in four different
cases. First, we measured the “fresh” SSD speed. Then we measured the speed
after the SSD had been fully filled with data twice. The third test occurred
after a 30-minute break during which the controller could partially restore
performance by running the idle-time garbage collection. And finally, we
measured the speed after giving a TRIM command.
We ran the tests in the artificial IOMeter
1.1.0 RC1 benchmark, where we measured the random write speed when working with
4 KB data blocks aligned to flash memory pages at a depth of 32 requests queue.
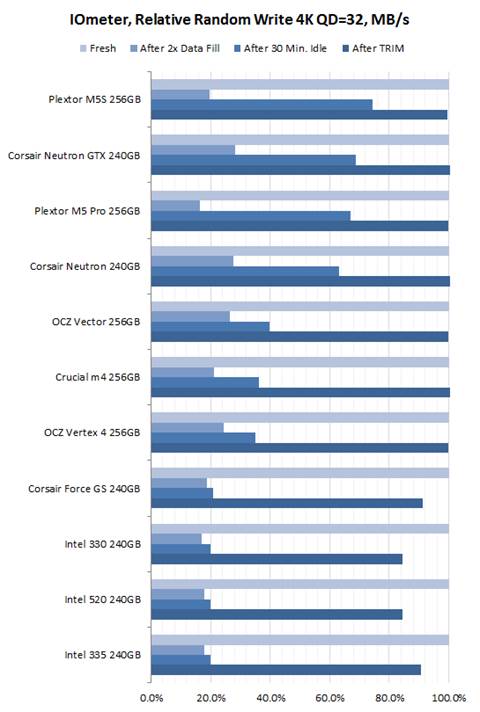
The following diagram indicates the history of the relative speed changes,
where 100% is equal to the SSD performance in “fresh-out-of-box” state.

Tests
run in synthetic IOMeter 1.1.0 RC1 benchmark
SandForce-based SSDs undergoes a
performance shock when they run out of free memory pages. They are getting
slower in use due to poor algorithms of garbage collection. This is actually
the controller’s problem because it can be observed with any firmware. The
performance hit has become less severe with faster flash memory as shown by the
Intel SSD 335 as well as the Corsair Force GS (which is equipped with 24nm
Toggle Mode NAND flash). The Intel SSD 330 would get 15% slower when writing
with a long request queue whereas the Intel SSD 335 only gets 10% slower when
writing 4KB data blocks with a long request queue.
Anyway, we wouldn’t recommend using
SandForce-based SSDs, including Intel ones, in any operating systems that do
not support TRIM. Otherwise, you may feel so disappointed with the eventual and
very noticeable degradation in the performance of your SSD.
Since the characteristics of most SSDs won’t
change once they change from fresh out-of-the-box state into the steady state,
we measure their performance once again using CrystalDiskMark 3.0.1 benchmark.
The diagrams below show the achieved results. We use random data writing and
measure only performance during writes, because the read speed remains
constant.

Sequential
write

Random
write 4K

Random
write 4K QD = 2, MB/s
Intel’s SSDs are much closer to each other when
it comes to steady-state performance, but the SSD 520 proves its higher position
as it is slightly faster than the SSD 335 and SSD 330. The two cheap drives are
similar in this test and do not give a strong impression when compared to their
opponents. Well, second-generation SandForce controllers have already appeared
for over two years, so you should not be surprised that they fail to compete
with newer solutions. Intel’s exclusive firmware cannot save everything, so the
only good news for the SF-2281 controller is that it is good for typical
desktop usage scenarios that involve a lot of reading.