WolfWiFi Pro
WolfWiFi Pro
from Enterprising Apps is a wireless toolkit for Android that
provides Wi-Fi surveying and scanning tools, supporting the 2.4GHz and 5GHz
bands. The demo version provides unrestricted use of the Wi-Fi Scan and
Channel Scan tools, but the Site Survey feature is loaded with a demo survey
and you’re limited to only one additional floor plan and five signal readings.
The full version removes the restrictions and is priced at $49.99, which
is offered along with the demo version in the Google Play store.

When
you open Wi-Fi Scan, you’ll see a summary listing of nearby access points with
details like their SSID
When you open WolfWiFi Pro, you’re greeted
by a simple home screen with shortcuts for each of the tools: Wi-Fi Scan,
Channel Scan, Site Survey, and Wi-Fi Manager. You’ll also find a button to
enable/disable the device’s Wi-Fi and Wake Lock button to control the device’s
sleep and dim settings.
When you open Wi-Fi Scan, you’ll see a
summary listing of nearby access points with details like their SSID, media
access control (MAC) address, signal level in dBm values, and an indication of
whether it’s secured. In the detail view you can see the channels, data rates,
and the exact security protocols.
In either view you can select an access
point to track its signal. It provides an enlarged signal reading with a bar
indicator and the dBm value. Plus you can enable the tone feature that plays a
tone that gets higher as the signal level increases to help you find the access
point.
When you open the Channel Scan tool you’ll
see a graph showing channel usage and AP signals in dBm values. You can also
tap a channel number to view the details of Aps on that particular channel.
Tapping the Wi-Fi Manager shortcut on the
WolfWiFi Pro home screen simply brings up the native Android Wi-Fi settings,
where you can see and manage the Wi-Fi networks you can connect to.
When you open the Site Survey tool you’re
greeted with a simple screen where you can create or open site survey projects.
When creating a project all you’re prompted to do is select a floor plan image.
Like with the AirMagnet AirMapper App, WolfWiFi doesn’t yet offer multi-floor
support so you’d have to create separate projects for each floor of a building.
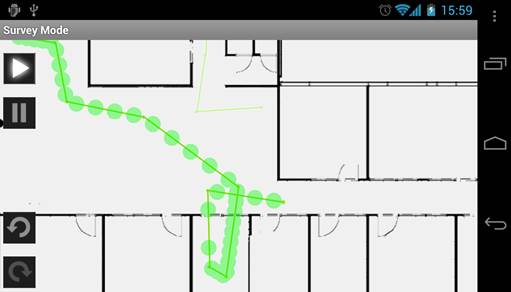
To begin surveying, you can walk around the
building and double-tap your location on the map to take signal readings.
During or after surveying you can long-press on a reading to see the captured
network and signal into.
In our testing we noticed the app
auto-rotates when moving the device around, which makes orientating your
location on the map a bit more difficult when performing a survey. You could,
however, disable the device’s screen rotation setting during surveying.

The
Site Survey tool is where you can create or open site survey projects
In the upper right of the app you’ll find
several shortcuts. The first shortcut shows you’re in the survey mode where you
can double-tap to take readings. The second shortcut brings up a gallery of
various network-related icon you can place on the map to represent items like
access points, antennas, routers, and workstations. Once you place items you
can manually input its network details and you can manage them by clicking the
third shortcut to open the Network Device Explorer.
The fourth shortcut on the top of the app
brings up the Filtering Options. There you can filter what access points or
signals are shown on the map via their MAC address, dBm signal level, or
channels. You can also enable/disable items on the map: signal heat map, access
point edge, tap points, survey path, speed (data rate values), and security
status (secured or unsecured).
The fifth shortcut on the top brings up the
undo options to remove the last signal or icon tap. The sixth shortcut pops up
the survey preferences to change settings, like showing icon tag info and the
size of icons and taps. And the last icon on the top provides shortcuts to the
other tools: Wi-Fi Scan, Channel Scan and Wi-Fi Manager.
You can export the survey results via the
menu options when in the Site Survey tool, which simply lets you save the
results to your device. Then you can use email or another app to send them or
plug your device into a PC to transfer them. You’ll find an image of the survey
map as it was in the app but a color-coded signal level bar is added.

WolfWiFi
Pro is a great and inexpensive mobile surveying app that provides other tools
Plus you’ll find a text file containing the
details of the survey readings, which you can open in the CSV format within
Excel for better viewing. You’ll find all the access point and connection
details, such as the SSID, signal level, channel, and MAC address of the access
point you were connected at the time of each survey reading.
Overall WolfWiFi Pro is a great and
inexpensive mobile surveying app that provides other tools as well, like
Channel Scan, to visually see channel usage and any overlapping issues. Another
differentiator from the other two solutions is the exporting. Although still
basic, it exports both the heat-map and access point details in formats anyone
can view.
WolfWiFi’s network icon and network device
explorer features are all the network details isn’t ideal. The UI could use
improvements as well. Fortunately, the developer says some of these issues will
be addressed in Version 2.0 along with other new and improved features.
Ekahau Mobile Survey
Ekahau Mobile Survey is an Android app that provides Wi-Fi testing and surveying tools,
available from Ekahau’s website for $399 when purchased separately. Unlike the
other two solutions, Ekahau doesn’t provide a demo version of its app.

Ekahau
Mobile Survey
When you open the app, you’re greeted by
the Test screen, which contains a network health monitor. It monitors the
access point signal level, data rate, packet loss, packet delay, and rogue
signals. It alerts you if any exceed your desired levels. These levels can be
manually defined or you can choose between predefined requirement profiles,
like email and web browsing or voice over Wi-Fi.
You can tap the bottom to display the
network details of your current connection with Wi-Fi and IP details. You can
also enable Background Monitoring so any network health alerts are saved in the
logs, which we’ll discover later.
On the Map screen is where you perform the
surveying. After importing a floor plan image you can calibrate the map by
selecting something on the map and inputting its length in meters. Then you can
enter the survey mode via the menu options and long-press on your location to
take readings. Once you’re done you can hit pause to see the heat map of signal
levels. You can adjust the threshold of signal levels shown on the map. You can
also select certain access points to see individual coverage and access point
details.
To perform multi-floor surveys, you can add
additional floor plan images and conveniently switch between them on the Map
screen. In the menu options you can export each individual floor map image,
which saves it to the device and allows you to email or export via other
methods.

One
unique feature of Ekahau Mobile Survey is the widget that you can place on one
of your Android home screens
On the access points screen, you’ll find a
listing of current access point details, including SSID, MAC address, channel,
security status, and signal level; all of which you can tap to sort the access
points by. On the Log screen, you’ll find a history of any network errors
detected by the network health monitor, such as access points with low signal
or data rate, rogue access points, or high packet delays. You can tap an entry
to review the details and even add your own notes about the issue.
In the app’s menu options, you can export
the heat map image and monitoring logs via email or methods. Plus, survey
projects created with Ekahau Mobile Survey and their Windows-based
Ekahau Site Survey software are compatible. So you can perform surveys with a
lightweight mobile device and later export the project to a PC or laptop for
in-depth analysis and reporting. And vice-versa; you can export projects from a
laptop and import them to a mobile device to do further surveying. Plus, you
can also move survey projects to different mobile devices as well.
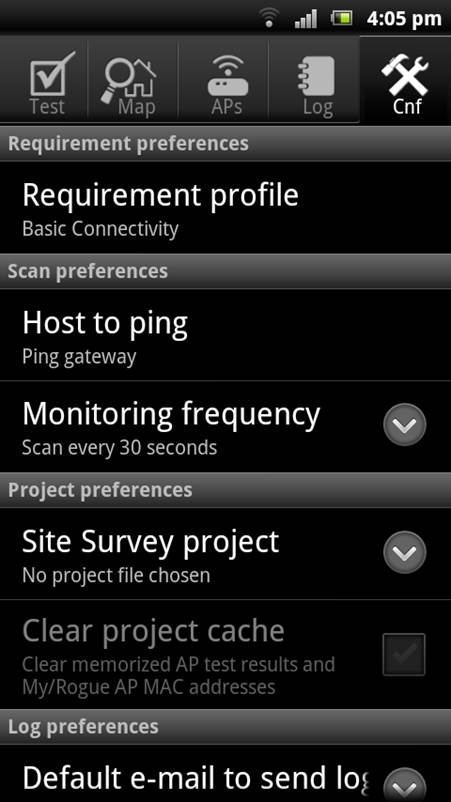
The last screen is the configuration
screen, where you can change the requirements for the network health monitor,
scanning preferences, and other project preferences.
One unique feature of Ekahau Mobile Survey
is the widget that you can place on one of your Android home screens. It
displays the signal level and data rate of your current Wi-Fi connection and
also lets you quickly switch the background network health monitoring on and
off.