Many analysts do not pay enough attention
to the power consumption of the processors, or there is just a small chapter
somewhere at the end of the review mentioning about this issue. However, in my
opinion, the power consumption of Socket FM2 platform is about to be the most
shocking experience throughout the review. Therefore, we decided to invest
seriously and attempted to determine which component of the system contributed
the most to that high power consumption number. To achieve this goal, we
measured the power consumption of the system in the nominal idle mode and in
different loading mode, such as: only CPU, only graphics core and the combined
mode. Next, we used the same measure methodology as that in overclocked mode
when we just overclocked just computing core, only graphics core and the whole
system overclocking. In this section, we are about to bring you collected
results with necessary commentary, and further in this review, we will apply
some principals to the real power consumption generally and to each component
in particular, so that we can analyze the detailed results and come up with the
appropriate conclusion.
We built the power consumption measurement
process by using Extech Power Analyzer 380803. This device was connected to PSU
before to measure the loss of whole system power (without monitor), including
the leak of power happening inside the PSU. In idle mode, we start with system
startup and waited until it stopped the receiving hard-disk process. Than we
used LinX to open the CPU, Cinebench 11.5 to open the graphics core, and LinX
and MSI operated at the same time, producing a complexly heavy loading process.
We chose these separate programs because they were able to anticipate almost
all levels of consuming power which the system needed for its everyday use in
practical applications. All results in the graph were categorized in an
ascending sequence. Let’s start with the graph showing the power consumption in
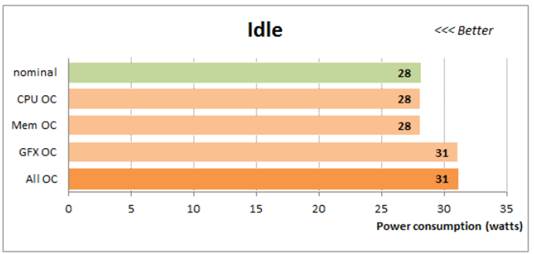
idle mode.

In
idle mode
Of course, we immediately noted that the
power consumption process of the system in idle mode increased during the
overclocking process, but we also believed that this was caused by the
increased Vcore of the processor. Surprisingly, it was the integrated graphics
core that was totally responsible for the increase of the power consumption in
the idle mode. The difference between 28 and 31 W was not a surprise at all but
in practice, it was considerably higher, over 10%, and keeping in mind that not
every computer fully loaded all the time, and the processor was one of its
power saving status. Therefore, the above increase of power consumed might be
true.

Only
CPU mode
We used to mention that we cannot measure
the power consumption of a system when it is heavily loading, because “Turbo
Core” technology lowered the frequency of the processor under the nominal
parameter. Therefore, we have to look for a compromise and unable the
parameters of the “Core Performance Boost” in mainboard’s BIOS. This is
obviously a useful assistance, helping changing the system operation
considerably. In the case that the clock frequency does not increase to over
3.8 GHz, its Vcore does not increase, and therefore the power consumption seems
to be less than in reality. Disabled “Core performance boost” does not cause
any effect on the level of power consumed of the system in the idle mode and it
is still 28 W. However, when the processor works more, the difference becomes
clearer and clearer. For example, as you can see in the graph showing the only
CPU testing mode, the nominal power consumption level of the system is 65 W,
while in reality, with “Turbo Core” technology, it is about 10 W higher. We
cannot answer exactly how much power the system needs when it is fully loaded
and when the CPU is 100% used, because in this case, the processor’s frequency
decreases and that is why we need the special help. However, it will be fairer
if assuming that in this case, the power consumption can be 10 or even 20 W
higher.

When
CPU is fully loaded
Despite that fact, we believe the received
result is reasonable and comparable. The problem here is LinX utility
influences on the processor strongly, more than the normal applications and
even under stricter conditions. As the result, even when disabling the “Core
performance boost”, the measured power consumed in the burn mode created by
LinX seems to be the same as the scenario that we saw when it operates its
normal applications and enable “Turbo Core”. We used the same principals in
selecting some utilities when we just opened a part of the CPU’s graphic and creating
the complex burn mode for the whole system. We chose programs to open the
system’s components based on their competition in the same power consumption
level as the normal practical applications, which users usually use everyday.
We are about to come up with the final
conclusion later, when we discuss operational numbers and received results in
order to give the intermediate verdict. Overclocked processor’s graphics core
has great effect in the idle mode, but its contribution to the power
consumption of the whole system is still 10%, it even falls to 4-8%, depending
on the type of the operational load. An increase in memory frequency almost has
no influence on consuming power. 6% is at most, but in almost every case that
it is between 1 to 3.5%. As we expected, the highest increase in power
consumption happens when the A10-5800K processor is overclocked: it reaches the
peak of 20-40%. The complex system overclocking boosts the power consumption
surprisingly, about 50 to 75%. Now let’s see how much operation performance we
receive during the overclocking process and where all of the power mainly goes
to.