Performance comparison
Just as usual, we will compare the
mainboard’s speeds of the mainboard in two different modes: nominal mode and
during overclocking all components of the system: processor, integrated
graphics card, memory. The first mode brings many interesting things as it
proves how well the mainboard works with other default settings. An obvious
truth that most users do not adjust their system, they just simply choose the
optimized BIOS settings and do nothing else. That is the reason why we run
around checking for everything without encountering with any interference in
the default mainboard settings. The results on the graphs have been sorted in
the descending order.
Nominal
mode
We used the Cinebench 11.5. All tests are
conducted 5 times and the average results of those 5 times of testing were taken
for the performance charts.

Cinebench
11.5
We used the Fritz Chess Benchmark utility
for a long time and it also proved that it was such a visual tool. It creates
repetitive results, in which the performances were recorded perfectly based on
the involved computational threads.

Fritz
Chess Benchmark
Checking the x264 FHD Benchmark v1.0.1
(64bit) allows comparing the system performance with available results
contained in a database. The average of 5 continuous passes is showed on the
chart below:

The
x264 FHD Benchmark v1.0.1 (64bit) allows comparing the system performance
We scaled the performance in the Adobe
Photoshop CS6 by our own benchmark made from the Retouch Artists Photoshop
Speed Test which is creatively adjusted. It includes editing four 24MP images
from a digital camera.

Adobe
Photoshop CS6 performance
In the storage testing, we used the LZMA2
algorithm to compress a 1GB folder, while other compressing settings are kept
at the default value.

A
1GB folder is compressed by the LZMA2 algorithm
Just like in the compression test, the
faster 8million of pi digits calculated, the better. The number of processor
cores does not really matter only in this benchmark, as it creates a
single-thread load.

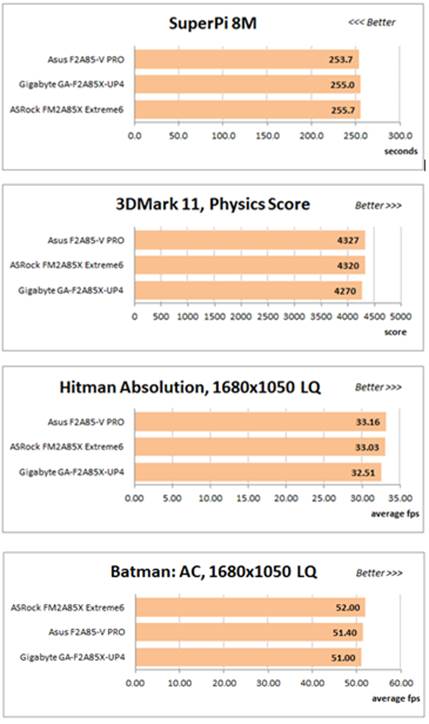
Just
like in the compression test, the faster 8million of pi digits calculated, the
better
The next chart shows the result of the
3Dmark11 CPU - Physics Score test. This score is recorded in special test that
emulates the behaviors of a complicated game system operating with many subjects.

The
result of the DMark11 CPU – Physics Score
The benchmark integrated into the Hitman
Absolution turns out to be so convenient. It can be launched directly from the
game, from the game launcher utility or even from the command prompt. We have
to use the lowest settings for the images and one of the lower resolutions in
order to gain an acceptable result.

The
Hitman Absolution turns out to be so convenient
The Batman game: Arkham City also reacts
positively to any change in CPU clock rate, but it uses DirectX 11. We run the
integrated benchmark 5 times in the game with high-quality image setting and
then take the average value to draw the diagram.

Batman:
Arkham City
As we mentioned in our previous review, when
1333 MHz level is set for the memory frequency, ASUS F2A85-V PRO and Gigabyte
GA-F285X Extreme6 use the timings of 9-9-9-24 instead of 9-9-10-24, which is
written in the SPD of the memory modules. ASRock FM2A85X Extreme6 set a precise
timing for the memory, but the benchmark results do not reveal this difference.
Based on the particular test, one or another mainboard take the lead, but it
cannot be pointed out on the chart. There exists a well-known fact that the
similar mainboard which operates under the same conditions will provide the same
performance, and that is what we can see here. It is only in the Batman: Arkham
City that the difference is more or less noticeable, but only on the diagram:
the fastest and the slowest just have a difference of 1 frame per second. You
cannot really feel its existence while playing games.
Overclocked
mode
In the overclocking tests, the clock rates
of CPU, integrated graphics and memory are the same for each mainboard, so we
hoped they will also provide the same performance once again.

They
will also provide the same performance once again

The
overall performance level for each mainboard
Gigabyte
almost always holds one of the lowest positions, and the gap becomes more
obvious in apps like 7-Zip, 3DMark11 and games
In fact, the overall performances are the
same for each mainboard, but we might notice some differences. Gigabyte almost
always stays at the lowest position, and the gap becomes more obvious in apps
like 7-Zip, 3DMark11 and games. ASUS almost always takes the lead while ASRock
stays in the middle, and struggles to win in the Batman: Arkham City battle
once again.