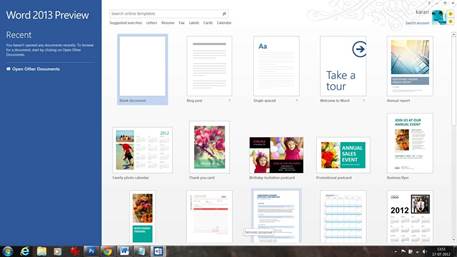
The new word incorporates new
features to enhance reading and sharing.
Read More
The new Word attempts to improve on content
authority by introducing a Read mode, which basically reflows text in columns
(and arranged in a horizontal strip) automatically to fit the screen. Both text
size and column width can be tweaked to your liking. It has other smarts too,
such as removing distractions, and only providing you with tools that are
relevant, and zooming into images is as simple as double-clicking,
double-tapping, or using the right click menu on the object. And because Word
automatically saves your last position in the document when close it; you can
pick up right where you left off. This works documents that you store on
SkyDrive too; you can start read a document on your tablet at home, and
continue on your des PC at work.

And
because Word automatically saves your last position in the document when close
it; you can pick up right where you left off
Add online videos
In the new Word, you can add web video
directly into a document. And it’s easy to search for videos right within Word
thanks to Built-in sources like Microsoft’s Bing search engine. You can also add
specific providers like YouTube and Dailymotion to search for and insert
videos. If you already have the embed code of the video, you can copy and paste
into Word directly. Another nicety is that once a video is inserted, y can
resize and position it anywhere you want - it pretty much behaves like an
image. You can even edit its thumbnail. Since Word supports Flash, Silverlight,
and IITML5, wee vet to find any vi that doesn’t play properly. Of course, the
prerequisite here is an Internet connection.
Enhanced Collaboration
By default, if you’ve signed your Microsoft
account, your documents are saved to the cloud. This makes collaboration easy,
as all you need is to man1and track version of the document. Comment tracking
also receives a boost: you can see who replied to whom and when right next to
the t text. Sure, this can get messy at times and hinder reading; in this case,
the neisimp1e markup view comes in handy. It lets you s a clean version of the
document, with hints to indicate when there’s a change (a red vertical line) or
a comment (a balloon). With a single click you can see all these changes, and
then hide them away again. If a comment has been addressed, you can mark it as
‘done’ to gray it out.

By
default, if you’ve signed your Microsoft account, your documents are saved to
the cloud.
Online Presentation
Via the free Office Presentation Service,
remote viewers can follow your presentation in their web browser by just clicking
on a link you send them. Also, they need not follow your screen as they can
navigate the document independently. During such online presentations, minor
edits (such as correcting a typo) can still be done. The coolest part of all
these is that your audience don’t need to have Word or any other product
installed on their computer.
Edit PDFs
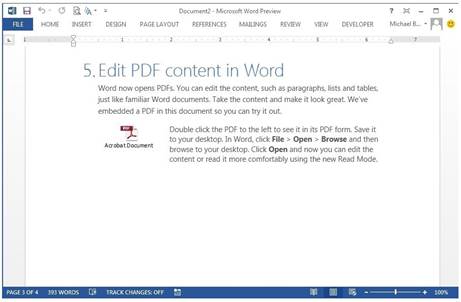
In Windows 8, the new Reader app lets you
view Adobe’s popular document format. The new Word goes one step further by
giving you the ability to edit these PDF documents. When you open a PDF
document, the new PDF Reflow feature uses sophisticated rules to reconstruct
the content into an editable Word document, while maintaining the original
formatting as much as possible. In our experience, it worked very well. Expectedly,
some formatting was lost during the conversion, and we got the best results in
text documents (headings, lists, and even tables were all correctly converted).

The
new Word goes one step further by giving you the ability to edit these PDF
documents.
Excel
Excel is now more interactive
Flash Fill
When bulk importing data into Excel, we
often had to spend an inordinate amount of time removing the separators, and
manually pasting them into separate columns. Flash Fill aims to make such
reformatting and rearranging of data a whole magnitude easier. It looks for
patterns when you enter data into cells, and then auto completes the remaining
data. No formulas or macros are required on your part. Here’s an example: If
you’ve a set of data consisting of both first and last names listed in a
column, and you want to extract just the first names into cells in the adjacent
column, type the first name a couple of times to establish a pattern. Excel
will guess what you’re trying to do, and show you what it thinks should be the
correct data for the remaining cells. If Excel is correct, hit Ctrl + E to fill
up the rest of the cells.
Quick Data Analysis
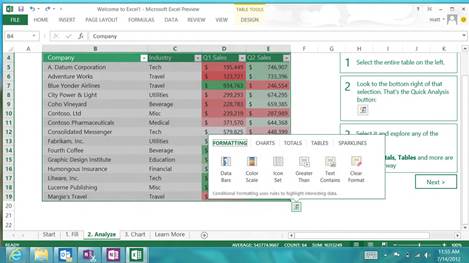
Quick Analysis is a great way to discover
different ways to visually represent and interpret your data. Simply select the
data, and click on the Quick Analysis icon that pops up at the lower right of
the highlighted data. You’ll be presented with a range of formatting, chart,
calculation, and pivot table recommendations that you preview by hovering the
cursor over the options. You can add conditional formatting (such as data bars
and color scale), perform common calculations (such as average and running
total), add Sparklines (which are micro-charts), and even see different pivot
views. Yes, you heard us right - Excel can now create a pivot table for you in
just a matter of clicks.

Quick
Analysis is a great way to discover different ways to visually represent and
interpret your data.
Recommended Charts
Like the Recommended Pivot Tables feature,
this feature found in both the Insert Ribbon and Quick Analysis. Because it’s
context sensitive, the algorithm will look for patterns on how your data is
arranged before suggesting a list of chart types. In past versions of Excel,
you’ve to create the chart to evaluate its appropriateness; now, the previews
just pop up as you hover over the options. And don’t be mistaken: this live
preview already has your data in it. That said, not all chart types available
in Excel are used by the recommendation algorithm. Chart types like 3D chart
and surface chart will never be recommended. If you need these specialized
charts, you can still find them via the individual chart type button on the
Insert Ribbon.

Like
the Recommended PivotTables feature, this feature found in both the Insert
Ribbon and Quick Analysis.
Integrate Apps
With the new Excel, you can embed little
apps into the spreadsheet. In fact, other apps in the Office suite like Word
and Outlook can have these apps inserted into them too. You can get them from
the Office Store (not to be confused with the Windows Store); those with
specific requirements (organizations, typically) can build their own. While
custom solutions for Excel aren’t new, what’s important this time round is that
by way of these small Office apps (which are essentially web pages), you’ll be
able to extend Excel to include web services content. This mashing up of local
data with data and visualizations available on the web enables you to do more
in Excel. For example, the Bing Maps app lets you use location data from a
given column and plot it on a Bing Map, giving you a new way to visualize the
data.