Troubleshoot or understand your Mac
better with this invaluable companion
Skill Level:
Could be tricky
It will take: Five minutes
You’ll need:
Mac OS X 10.6 or higher
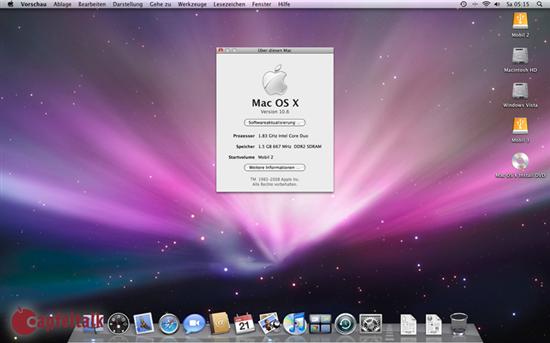
Apple introduced the Activity Monitor app
in OS X 10.3, and it can still be found in the same location on your Mac inside
the Applications > Utilities folder.
All sorts of complex things go on behind
the scenes of OS X, and its slick and friendly interface masks a highly
technical set of processes and hardware/software interactions that make
everything run smoothly. The average user might ordinarily have no need to
uncover these kinds of things, but for any kind of troubleshooting, being able
to see what’s happening under the hood is useful. Even if there’s nothing
wrong, understanding the way your Mac works can help you to head off potential
problems, or see what kinds of upgrades you need to make.
Activity Monitor lets you view various
statistics about your Mac. The CPU usage viewer is handy because it lets you
see what is using processing power and therefore what may need to be quit or
force-quit in the event of your Mac struggling. Similarly, viewing System
Memory stats helps you to understand what’s sucking up RAM and if you may need
to fit more. Disk Activity can reveal issues about over-active apps, and Disk
Usage shows how much space is left. Finally, Network is great for viewing
network speeds and activity, which is crucial for network troubleshooting. You
can sort processes by type, to view, for example, only the apps you are
running. and hierarchically to see what’s using the most resources. All in all,
it’s a quietly brilliant little app, and one that you should know about.
Apple
introduced the Activity Monitor app in OS X 10.3, and it can still be found in
the same location on your Mac inside the Applications > Utilities folder.
Where to head to first
1. CPU section
The CPU section will show you how many
processor cores your system has. A floating CPU window can be left on-screen
even when the main window is hidden, and the CPU History window helps you to
see how your computer has been loaded over time. If your fans are running a lot
and your Mac seems unresponsive, use this section to see what’s eating CPU
power.
2. System Memory
The System Memory section helps you to
understand how RAM is being used. We can see a list of processes and the ‘Real
Mem’ column has been ticked to sort the list based on the amount of memory
being used. At the bottom you can see a pie chart with the total installed RAM,
and then coloured sections displaying how much is currently in use, free and
reserved.
3. Inspect button
By using the Inspect button at the top of
Activity Monitor’s window you can get more information on running processes.
Here, for example, the Finder is using different amounts of RAM and only a
small amount of CPU. The other tabs can show information about any open files
associated with an application or process, and you can also quit a process from
this window.
Understanding activity monitor
Understanding
activity monitor
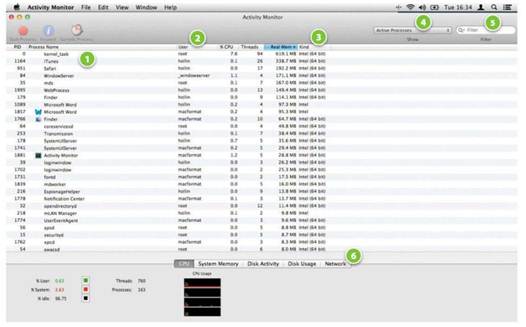
1. Process name
The name of a process usually gives you a
pretty good idea of what it is. Certainly in the case of apps like iTunes, Word
or Photoshop, you’ll be able to tell at a glance. The Process II) is also
useful to know if you ever have to force terminate a process using the
Terminal, but that’s for more advanced users. The more esoteric process names
are for system level stuff, and generally shouldn’t be messed with.
2. User name
OS X supports various types of users and also
multiple users logged in at the same time, although not actually interacting
physically with the system at the same time. The root user is the system itself
and this is listed as being the instigator of the various core system processes
like running the kernel and low-level security processes. There are two users
logged in here, and they are both running processes, though one is only logged
in in the background.
3. Memory and kind
OS X 10.8 is a fully M-bit system, but
capable of running 32-bit apps for reasons of compatibility. You can see from
this list that al system level processes are Intel M-bit and a couple of
third-party apps and drivers are not. If you need to know if a process is 32 or
64 bit, this is where to find out. You can also see the list is sorted
hierarchically by how much memory is in use, which is also useful.
4. Process sorting
OS X runs various types of processes, and
you can choose to filter them by type. There are active and inactive processes,
system and user processes, and Windowed processes, meaning apps that are
currently displayed in a window in the Finder. It’s useful to be able to sort
the list to show only the processes you have initiated, as this won’t display
all the core OS X stuff.
5. Filter processes
If you need to quickly find a process to
determine how it is behaving or misbehaving as the case may be, it can be a
good idea to simply type its name into the search field here. This saves you
sorting the list and then sorting through the results and depends only on your
having a decent idea of what the name of the process might be. In the case of
apps its usually enough to type the name of the app, and everything relevant
should show up.
6. Viewing tabs
View performance and operation stats using
the tabs at the base of the window. CPU and Memory will help diagnose
performance problems, and Disk Activity and Usage will alert you if your drive
is getting full or writing too much data, which can be a sign of problems.
Finally, Network can display how much data has flowed in and out of your system
as well as current and peak speeds.