The perennial command for monitoring a
Linux system is called 'top'. There isn't a Linux distribution, or even a UNIX
installation, that won't display a dynamic process list, along with the distinctively
cryptic usage table, when you type this command. The process list is sorted by
usage, with the most CPU hogging tasks at the top. If you’re still running the
previous ‘stress' command, you should see four separate 'stress' processes.
These equate to two for the CPU tasks, one for the memory allocation process -
this should be obvious from the size of the 'VIRT' column -and one for the file
system input/ output. Anything else that's fighting for contention should be
bubbling up and down among these tasks. The top table displays the uptime for
your machine, how many users are logged in and the trinity of the 'load
average', which makes no sense if you've not encountered it before, but they
are important for monitoring your system overtime. This is what it looks like
for us: load average: 1.14,0.78,0.20.

Use
htop to get a slightly prettier representation of your data
Those three numbers represent load average
over progressively longer periods of time; 1,5 and 15 minutes, from left to
right, and the number represents the demand being placed on your CPU. Note that
1.0 is the equivalent to 100 per cent of a single CPU (2.0 would be the
equivalent of 100 per cent across two CPUs, if this is your system
configuration), and that's with no other processes waiting to use the CPU,
whereas 0.5 is 50 percent of a single CPU. In our system, over the previous
minute, the CPU capacity was overloaded such that 0.14, or 14 per cent, of
processes, were waiting to run. The previous measurements show the state of the
system as we stopped and ran stress, taking the CPU to roughly 80 per cent and
20 per cent. This is why server admins look horrified if they've got a number
over 0.8 for either the 5 or 15 minutes entries, because it means (unless
you're being Slash dotted) there's some wayward process running wild on the
system. If you want a prettier alternative to 'top1 without going all
graphical, many distributions include 'htop' which presents the same
information, only in a slightly more eye-friendly format.
StressLinux
As effective as the solutions we’ve covered
are, they're not designed for burn-in testing, and while you could easily
litter your Linux installation with further package installation, this is one
of those times where a specific Linux distribution makes a lot of sense. Using
a Live CD instead of an installation, for instance, safeguards your personal
data should testing result in a system restart or total failure.

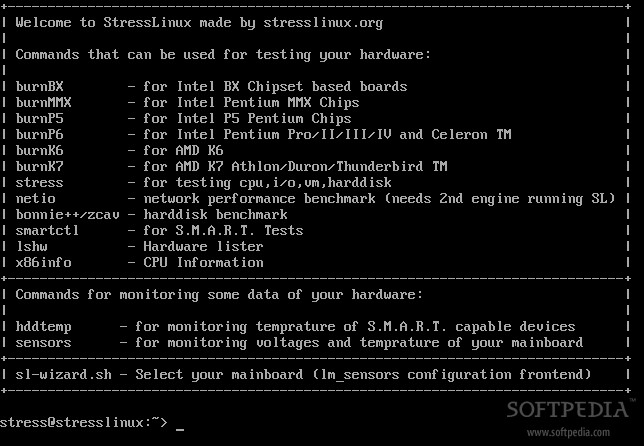
StressLinux
includes tools for stressing your CPU, memory, network and storage
There are several distributions that can do
just this, but our favourite is the aptly named Stress Linux. Unlike Ubuntu,
it's a no-frills distribution that simply packages the tools you need to test
your hardware and nothing else. The advantage to this is that it’s a small
distribution, with the 64-bit ISO download taking around 220MB, and there are
images for both USB sticks and a VMware appliance if you need alternatives.
On first boot, choose the default option
from the Start menu, and a few moments later, you'll see the login prompt. The
default login and password is 'stress' for both, after which you'll be asked to
choose a keyboard layout followed by a script called 'sensors-detect'. See the
box' Temperature monitoring over the page for further details, otherwise, skip
this step by selecting 'no’ for every option. You'll then be dropped back to
the command line, where you'll see a useful list of included utilities.
Burn utilities
In the list of utilities, you'll see
'stress' as well as other tools that will put your storage and networking
through the ring of fire. But the ones we're interested in are the 'burn' commands.
These are designed to specifically heat up your CPU using hand-crafted
assembler code to target every area of your silicon. The platforms supported,
as described by their names, are dated, but choosing between 'burnK7' and
'burnP6', for AMD and Intel platforms respectively, will still yield good
results on modern hardware.
You will also need to run an instance of
each command for each CPU core. But unless you've got a little Linux
experience, it won't be obvious how to do this from a single command prompt.
The answer is to either switch to a different login prompt with [CTRL] + (Alt]
and a function key, or to run the command as follows: nohup burnP6 &.
This will run the burn command in the
background and allow you to continue typing into the terminal, and you can
enclose as many commands within 'nohup' and to run as many processes as you
wish. It's then a case of making sure your fire alarm is working and leaving
your system running for a day or two. If your PC survives, it’s in awesome
shape. If not, you'll need to look into buying extra cooling or power
provision.
Monitoring temperatures
All the burn-in tools we've covered are
great for stressing out your system, but they provide very little feedback.
This is because most people will monitor the state of their systems using
different methods. The best way on Linux is to install a package called
'lm-sensors'.

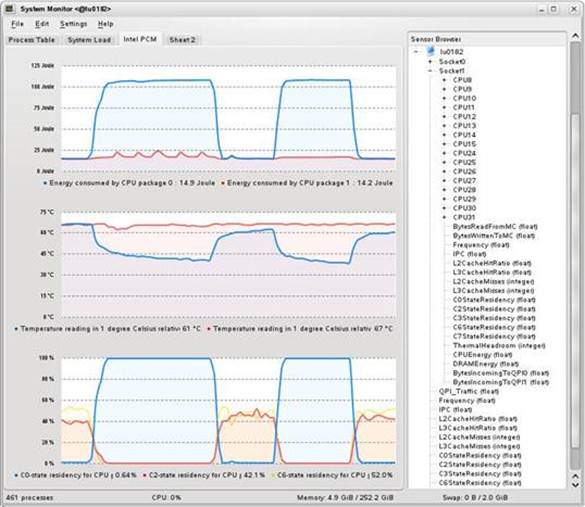
There
are many graphical front-ends to 'sensors'. Just search through your distros
package manager and try a few. This one is KDE's KSysGuard
This will then give you access to a script
called 'sensors-detect', which you'll need to run from the command line with
system administrator privileges -type sudo sensors-detect from the Ubuntu
terminal, for example. You'll then be asked a series of questions -these are
the same questions asked by the StressLinux distribution, because it’s
configuringthe sensors package for you. You can mostly leave the questions at
theirdefaultvalues, and sensors-detect will go off and attempt to discover the
various sensors within your system. The final question will ask whether the
tool can create a configuration file. Say'Yes', and everything should be
configured. Now, when you type sensors as an ordinary user, you'll see a table
containing the various readings for your hardware, and you'll be able to
monitor the effect your stress testing is having on your system.