Comparing performance
As usual, we will compare the motherboard
speed in 2 different modes: in nominal mode and in the overclocking process of
all system components: processor, built-in graphics core, memory. The first
mode is quite interesting because it shows that how the motherboard works with
its default settings. That’s a fact that is known by most of users who don’t
fine-tune their system, they just simply select the optimal BIOS settings and
do nothing. That’s the reason why we run a cycle of test that barely interveres
any factor with the default settings of the motherboard. The result on the
diagram is arranged in descending order of operation and the result of MSI
FM2-A85XA-G65 is marked by a darker color.
Nominal
mode
We use Cinebench 11.5. All the test was ran
5 times and the average result in 5 times was taken for the performance chart.

Cinebench
11.5 benchmark
We used Fritz Chess Benchmark utility for a
long time and it was able to perform illustration. It created a repeating
result, performance in scale completely depended on the number of the related
calculating topic.

Testing
with Fritz Chess Benchmark
x264 FHD Benchmark v1.0.1 (64bit) test
allowed comparing system performance to a database with the existing result.
The average level of the 5 consecutive tests is performed on the following
chart:

x264
FHD Benchmark test
We measured the performance in Adobe
Photoshop CS6 using our own standards made from Retouch Artists Photoshop Speed
Test which was creatively edited. It included editing the typical images 4
24-megapixel images from a digital camera.

Adobe
Photoshop CS6 test
In a test of saving a 1 GB file compressed
by using LZMA2 algorithm, while the other compressing settings were set at
default.

7-Zip
9.20 test
Like the data-compressing test, the faster 8
million of Pi digits was calculated, the better it was. This was the only
standard which the number of processing core didn’t matter because it created
single-threaded load.

SuperPi
8M test
The next diagram showed the results at 3DMark11
CPU - Physics Score test. This score was recorded in a special physical test
reproducing the behavior of a complex gaming system working with many subjects:

3Dmark
11 test
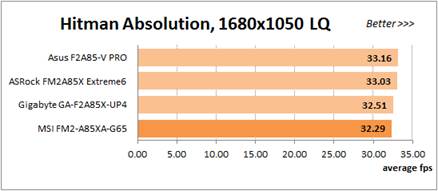
Scoring on a system integrated with the Hitman
Absolution game turned out to be very convenient. It could be advanced directly
from the games and even from the command prompt. To have the min result that is
acceptable, we had to use the lowest image settings and use one of the
low-resolution modes.

Hitman
Absolution test
Batman: Arkham City game also responded
vigorously to any changes in CPU clock frequency, but it used DirectX 11. We
performed scoring this gaming system 5 times with high image-quality and then
got the average result of those 5 times and put on the diagram.

Batman
test
In MSI FM2-A85XA-G65 nominal mode, it’s not
much different from other models. the same motherboards can easily create the
same performance under the same condition, as we have seen here.
Overclocking
mode
In the overclocking test, we performed at a
CPU, the graphics core and memory clock rate was similar with each motherboard,
so we can expect them to provide the same performance one more time.

Cinebench
11.5 test

Fritz
Chess Benchmark test

x264
FHD Benchmark test

Adobe
Photoshop CS6 test

7-Zip
9.20 test

SuperPi
8M test

3Dmark
11 test

Hitman
Absolution test

Batman
test
Indeed, the motherboard delivered the close
results, but MSI FM2-A85XA-G65 was slower than the average level in the apps
like 7-Zip, 3DMark11 and the games. It’s similar to the Gigabyte motherboards,
the models seemed to be slower in the same test. Anyhow, the difference from
the other motherboards was not much when performed seriously.